Walter Shewhart's Legacy: The Connection Between Statistics and Manufacturing
12/18/10

Quality control has a rich history that can be traced back to the guilds of the Middle Ages, where an apprentice would go through a long period of training. This model eventually led into large-scale production lines in the Industrial Revolution with inspection to help improve quality. This led into modern quality control, or statistical quality control, where statistical tools are used to assess quality. This article is about Walter Shewhart, who is regarded by many as the "father of modern quality control", his theories, and how his theories were guided by manufacturing data.
In the past, if inspection found a defect, a cause for the defect was found somehow, and that cause was changed. It all sounds very sensible, except that it was somewhat subjective. If you're adjusting a process in this manner you may actually be increasing poor quality, not eliminating it.
Shewhart was a Ph.D physicist by trade, who worked as an engineer at Western Electric in the 1920's and at Bell Telephone (which later became AT&T) in the 1920's until his retirement. He taught that data contain both signal and noise, and that one must be able to reliably separate the two to find the signal. To accomplish this, Shewhart created the control chart, which is a way to plot data from a process along with calculated upper and lower bounds. Single points, or a collection of points, that are departures from random chance can be identified on the chart and investigated.
As an example, consider steel cables that arrive in 40 batches, each batch containing 5 cables. Consider plotting the mean cable diameter of each group, along with the range (ie. max diameter in a group – min diameter in a group), over time.

From the control chart, batches 9 and 35 need further investigation. Who was working that day? What materials were being used? Were the machines working properly? Were the temperatures controlled properly? Were the machines left running during a fire alarm evacuation because someone burned toast? Should we devote time, staff, and money to investigating batch 15 just because someone, maybe a supervisor or someone even higher up the chain, pointed out its mean diameter is "below average"?
The main difference from the previous way of quality control is that statistical rigor is being used in the form of statistically calculated upper and lower bounds and using various rules based on probability (see the key in graph for examples) to determine if a process is "out of control". Counts are often plotted, but totals, running totals, averages, ranges, standard deviations, variances, and proportions can be as well.
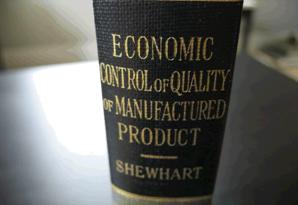
Shewhart detailed his work in Economic Control of Quality of Manufactured Product (1931), and later in Statistical Method from the Viewpoint of Quality Control (1939), with Ed Deming, both of which are great reads.

Shewhart influenced Deming tremendously, and the two had a long, successful collaboration. Deming himself had an incredible career at the U.S. Department of Agriculture, U.S. Census Bureau and as a statistical consultant in the United States and Japan. The famous "Deming cycle" of
- Plan
- Do
- Check
- Act
- Goto Step 1
which is familiar to students of Project Management and other disciplines, was actually called the "Shewhart cycle" by Deming.
What is interesting to me is that manufacturing processes serve as the input to the control charts. That is, without manufacturing, there wouldn't be important products being created, datasets from the process, nor statistical theory from people investigating the process. Without manufacturing processes providing the impetus for Shewhart's work, the probability of making correct decisions based on manufacturing data would be much smaller.
Please anonymously VOTE on the content you have just read:
Like:Dislike: