Using Z-scores to Monitor Network Traffic
12/19/18
Consider this situation: Your company, at times, notices a large amount of data going to to various countries. Your company has business in other countries, but the total size of the data moving around caught your eye as odd, as may have the specific countries involved. What type of statistical tool can you use to monitor this type of situation?
This issue arose recently in some consulting work, and is essentially one of identifying outliers. Outliers are data that are much more extreme than what you would expect. Outliers could indicate mistakes, such as data entry in survey work (someone reporting in units of millions rather than in units of thousands), or legitimate but surprising data, like an upward shift in a trend. Typically when we talk about outliers we mean large outliers. Data that is much smaller than what you would expect are called "inliers". Seriously. That was not a statistics joke!
There are many ways to detect outliers. One could use various ratios, resistant fences, asymmetric fences, Mahalanobis distance, regression, time series analysis, quality control charts, changepoint analysis, and on and on. For this project, we weighed all requirements and the pros and cons and decided to use graphs and a simple Z-score.
After calculating the average and standard deviation of your data, the Z-score is calculated as
This is just standardizing your data, that is, making it have a mean of 0 and a standard deviation of 1. Theory says that if the population the data is coming from is also normally distributed, which is unlikely in this case with file sizes, the Z-score is furthermore normally distributed. This fact can allow us to calculate probabilities. We'd rarely expect to see large Z-scores, as the table below shows, and data leading to large Z-scores would be improbable, and therefore be considered outliers.
Here is a table of Z-scores and the probability of observing a score more extreme than that Z-score:
Z-score |
Probability |
0 |
50% |
1 |
15.87% |
2 |
2.28% |
3 |
.135% |
4 |
.003% |
5 |
.000029% |
6 |
.000000099% |
These probabilities can serve as a guide to setting a "cutoff" to determine outliers. Test data and preliminary real data suggested that Z-scores >= 2 gave good indication of an outlier. Note that this cutoff could be revised upwards in the future. One could also set "zones", such that a Z-score in a certain zone means to take an action, to investigate further, to not use that data in some other application, and so on.
The client I consulted with made graphs of Z-scores for each of the dozens of IP addresses like the graph below
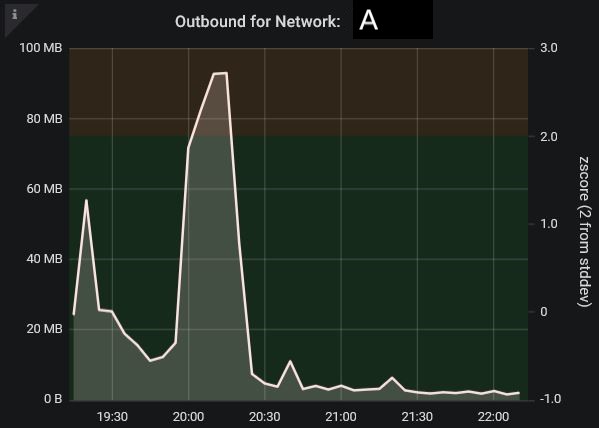
Also, sums of outbound traffic were displayed by country, and every graph was made drilldown-able, and linked in time, with data refreshing being done every 30 seconds.
Thank you for reading!
Please anonymously VOTE on the content you have just read:
Like:Dislike: