Flattening Intervals
7/31/18
Often in a statistical analysis we're creating confidence intervals to express a probable range for an estimate. For example, something like "The 90% confidence interval for X is [low, up]", indicating that if the experiment was repeated many times, we'd expect 90% of those intervals to contain the true X. We may only create one such interval, but we could create many intervals. For example, what if we had an interval for X for each state? Or what we if create an interval for X each year for 10 years in a row? We may need a simple way to summarize these intervals.
To illustrate this, consider these two intervals:
- [1.5, 2]
- [1, 2.5]
It is clear that the first interval is completely contained in the second interval, so to summarize this fact, these two intervals can be collapsed or "flattened" into the interval [1, 2.5].
But in this case,
- [1, 2]
- [3, 4]
these intervals do not overlap at all, hence we cannot combine them.
In this case,
- [1, 2]
- [1.5, 4]
these intervals have overlap, but only a partial overlap, so it may make sense to flatten them into the interval [1, 4].
For the purpose of flattening intervals, we can use this general logic to check if an interval (low1, up1) overlaps with an interval (low2, up2):
- if not(up1 < low2 or up2 < low1) then "overlap"
- else "does not overlap" (ie. "statistically significant")
Statistically speaking, if there is no overlap, the confidence intervals are "statistically significant". If there is any overlap, however, we cannot, technically, say the intervals are the same. The intervals still may or may not be statistically different from each other. In this problem, however, our focus isn't so much on issues of statistical significance as it is on summarizing and communicating the set of intervals. That is, we can pretend these intervals are just regular old intervals and not confidence intervals from a statistical process.
The above logic is how to do it in a program. In Excel, however, we can accomplish this graphically. Here is an example with 10 intervals (blue) and the flattened intervals (red):
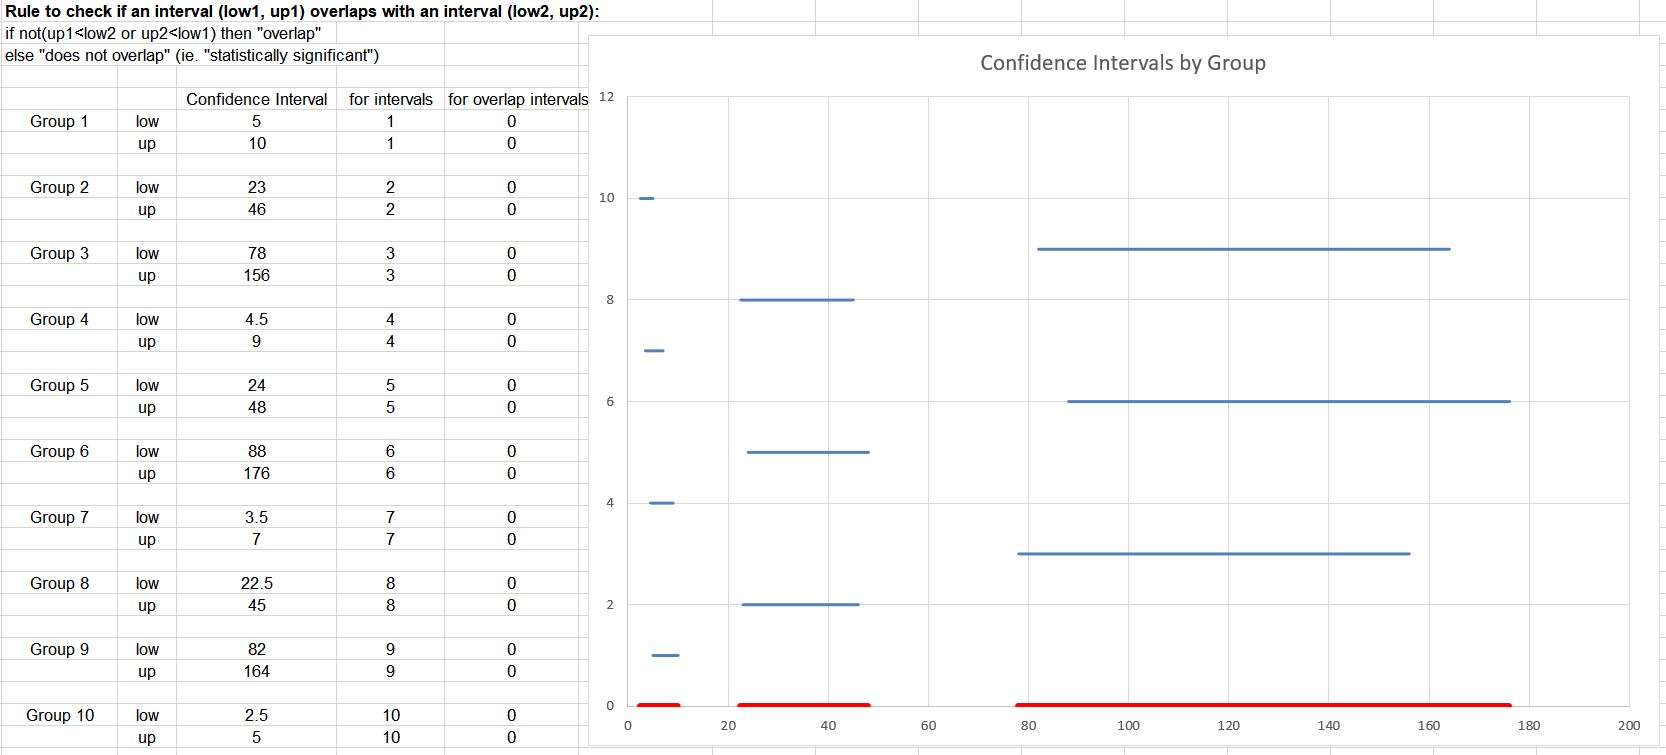
Please check out this spreadsheet so you can play around with the numbers. Also, check out this R code to do the same via a program. For this example, the R code gives the output
- [2.5, 10]
- [22.5, 48]
- [78, 176]
which matches with Excel.
Thanks for reading!
Please anonymously VOTE on the content you have just read:
Like:Dislike: