Compounding Errors
7/11/11
I thought I'd blog about something we all try to avoid: making errors. In the work you do, you probably work with an overwhelming number of processes and numbers. An error at any one of these steps can be passed on to another step. The errors that I am referring to are called "non-sampling errors". Managers are especially cognizant of errors and seek to minimize them through careful planning and training.
I wanted to give a simple demonstration of how seemingly microscopic errors can add up to very large errors. Pretend for a moment that your job consists of taking a number given to you from a predecessor process, squaring it, multiplying it by 2, and then subtracting 1 from that quantity. After you are finished, you pass your calculation to the next person in your office who does the same thing but uses your number as their starting point. This process is done by all 100 people in your office, and then the final number, after the 100th person has completed their calculations, is published on the Internet for the entire world to scrutinize (nervous yet?). Using notation, you are given X0 from a predecessor process, and your office computes Xn+1 = 2Xn2-1, and X100 is published.
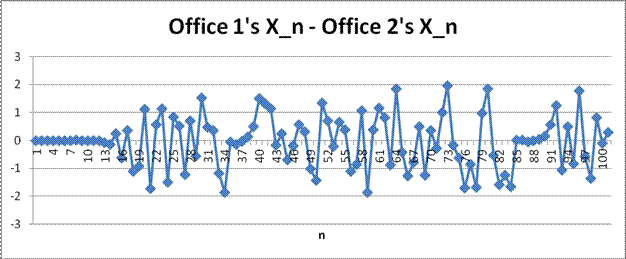
Consider an office starting with the correct X0 = .04 and another office starting with the incorrect X0 = .03999. You'd expect that X100 for each office would be about the same, since .04 and .03999 are so close. Actually, the Xn from this process start to differ drastically for n as small as 13. Often the Xn from this process even have different signs when comparing across offices. Here are the numbers for the first 15 steps
n
| Office 1's X0
| Office 2's X0
| ||
0
| 0.04
| Office 1's Xn
| 0.03999
| Office 2's Xn
|
1
| -0.9968
| -0.9968016
| ||
2
| 0.98722048
| 0.987226859
| ||
3
| 0.949208552
| 0.949233741
| ||
4
| 0.801993751
| 0.802089391
| ||
5
| 0.286387954
| 0.286694782
| ||
6
| -0.835963879
| -0.835612204
| ||
7
| 0.397671214
| 0.396495512
| ||
8
| -0.683715211
| -0.685582618
| ||
9
| -0.065067021
| -0.059952947
| ||
10
| -0.991532566
| -0.992811288
| ||
11
| 0.966273657
| 0.971348508
| ||
12
| 0.867369562
| 0.887035848
| ||
13
| 0.504659915
| 0.57366519
| ||
14
| -0.49063674
| -0.341816499
| ||
15
| -0.518551178
| -0.766322961
|
The final values of X100 for the offices are .054 and -.232, respectively. Here is a graph of the differences between offices at each step.

Of course this toy example is silly because it is so far removed from what we do in reality.
On the other hand, our tasks in reality are even more complex, demanding more attention to possible errors. In any case, I hope this demonstrates the value of working carefully at each step of a process, especially at the beginning - the utility of our publications may depend on it. Careful planning at the end of a process can be a case of "too little too late".
Please anonymously VOTE on the content you have just read:
Like:Dislike: