Dollar Cost Averaging Vs Lump Sum
5/6/10
There are many ways to invest, and this simulation considers two of them.
Consider wanting to invest $X. You can invest an amount, $a, every so many days, d, such that d*$a = $X. You could also, of course, just invest $X at the start.
The first way mentioned is basically called Dollar Cost Averaging. The second way is called Lump Sum.
I considered $200 being invested every 30 days for a year and compared the results to a $2400 (=12*$200) lump sum payment. Of course, each realization should be compared under identical market conditions, which would vary randomly from simulation to simulation. Also, the commissions (say $10 per trade) should be taken into account, with Dollar Cost Averaging having 12*$10 = $120, and Lump Sum having $10.
Valid issues like the dollars not yet invested earning interest were not considered for this simplistic simulation.
Here is a typical screenshot:
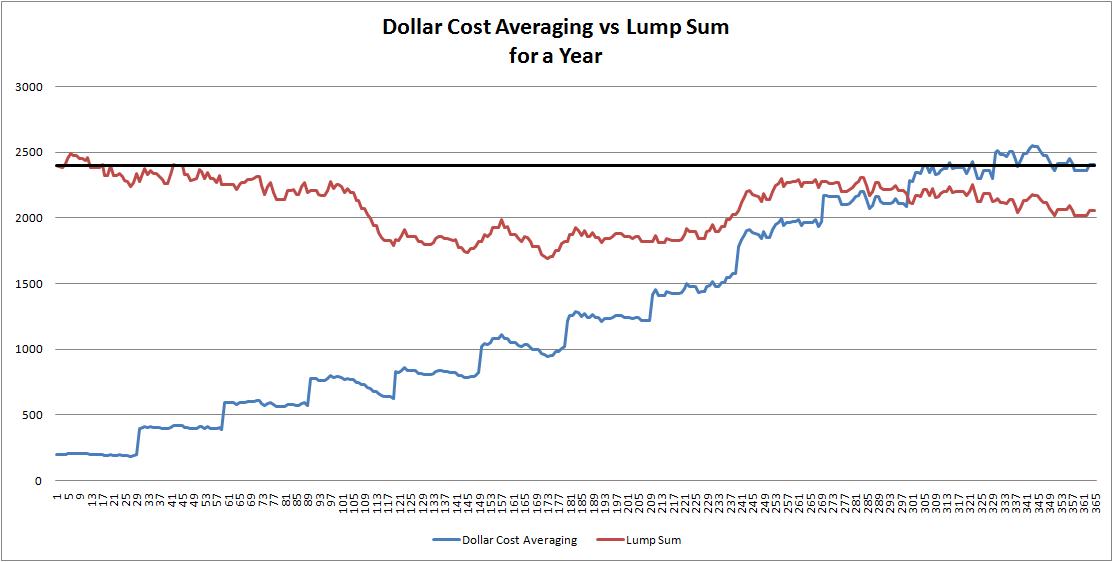
From watching the simulation many times, it is clear the winner depends on the market conditions. Obvious? Yes. But it is nice to have a clear, and free, demonstration of these facts.
The Dollar Cost Averaging Vs Lump Sum simulation is available here.
Note, that on 2/28/16, I added a simulation section to it with a Visual Basic macro called "Simulate". The simulation runs for however many trials you specify, saves all the data, and calculates the percent of the time Lump Sum and DCA win, with and without taking commissions into consideration. The original simulation only made the market direction (ie. up or down for a day) random. I made it so the user can change this parameter to simulate if the market for the whole year is an "up" or "down" market.
Please anonymously VOTE on the content you have just read:
Like:Dislike: